Sales & Analytics Dashboard Modules
Sales & Analytics Dashboards That Turn Pipeline Activity Into Executive-Grade Decisions
This module provides sales teams and executives with immediate visibility into pipeline performance, deal quality, and execution reliability. It translates sales activity into measurable indicators like close rates, SLA adherence, and average deal value. By centralizing performance signals, the system reduces decision latency and prevents revenue blind spots from persisting unnoticed.
From Fragmented Sales Signals to Unified Revenue Visibility
Before this module, performance insight depended on manual reports, disconnected tools, and delayed interpretation. Sales activity occurred without clear feedback loops, leaving leadership reactive and teams misaligned. After implementation, pipeline behavior, execution quality, and revenue outcomes are visible in one system, enabling faster intervention and confident forecasting.
01
Home Page (Acquisition & Positioning)
Captures initial attention and positions the offer clearly, converting anonymous visitors into motivated inbound leads.
02
Form Funnel
Qualifies and routes leads through structured questions, surfacing intent early while filtering out low-fit inquiries.
03
Sales & Executive Dashboard
Centralizes deal activity and priorities, allowing for real-time visibility over the pipeline, and transforms activity into actionable insights.
04
CRM & Kanban
Structures lead records, deal stages, and activity history into a disciplined pipeline that ensures consistent follow-through and accountability.
Revenue Visibility Breakdown
Fragmented Reporting Obscures Pipeline Reality and Executive Control
When sales insight depends on scattered tools and manual reporting, visibility degrades across the entire revenue system. Decision-makers operate on delayed or incomplete information, increasing risk and uncertainty. The cost appears as missed priorities, slower reactions, and preventable revenue loss.
01
Sales Operates Without Clear Priority Signals
Sales teams lack real-time clarity on pipeline health and action urgency. Manual aggregation delays feedback on stalled deals or breached SLAs. High-value opportunities degrade before corrective action occurs.
02
Executives Lack Reliable Revenue Awareness
Leadership cannot confidently assess close rates, deal quality, or stage performance. Fragmented data forces retrospective analysis instead of proactive decision-making. Strategic support arrives too late to influence outcomes.
03
Operational Effort Replaces Strategic Focus
Teams spend time assembling reports instead of acting on insights. Multiple data sources introduce inconsistency and interpretation errors. Business energy shifts from execution to reconciliation.
Unified Decision Infrastructure
Centralized Dashboards Restore Control Over Sales and Revenue Performance
The sales and analytics dashboards consolidate critical signals into a single source of truth. Automated aggregation replaces manual reporting and removes visibility gaps. Both sales and executives gain aligned, real-time understanding of performance.
Immediate Pipeline Clarity for Sales Teams
Pipeline status, deal progress, and action priorities are visible at a glance. This reduces guesswork and accelerates corrective action. Sales execution becomes deliberate rather than reactive.
Executive-Level Performance Transparency
Revenue metrics, stage health, and close rates are continuously tracked. Leadership gains confidence in forecasting and intervention timing. Strategic decisions are grounded in current reality.
Automated Aggregation Eliminates Reporting Drag
Data flows directly from operational activity into performance views. Manual compilation and reconciliation are removed from daily operations. Efficiency improves without increasing headcount.
Shared Visibility Aligns Teams Around Outcomes
Sales and executives operate from the same performance narrative. Misalignment caused by conflicting reports is eliminated. Accountability and coordination improve across the system.
Operational Visibility Layer
Dashboards Translate Sales Activity Into Actionable Business Signals
This walkthrough demonstrates how sales and analytics dashboards surface decision-critical information without manual interpretation. Each view condenses complex pipeline behavior into immediately readable performance signals. The intent is faster prioritization, clearer accountability, and earlier intervention.
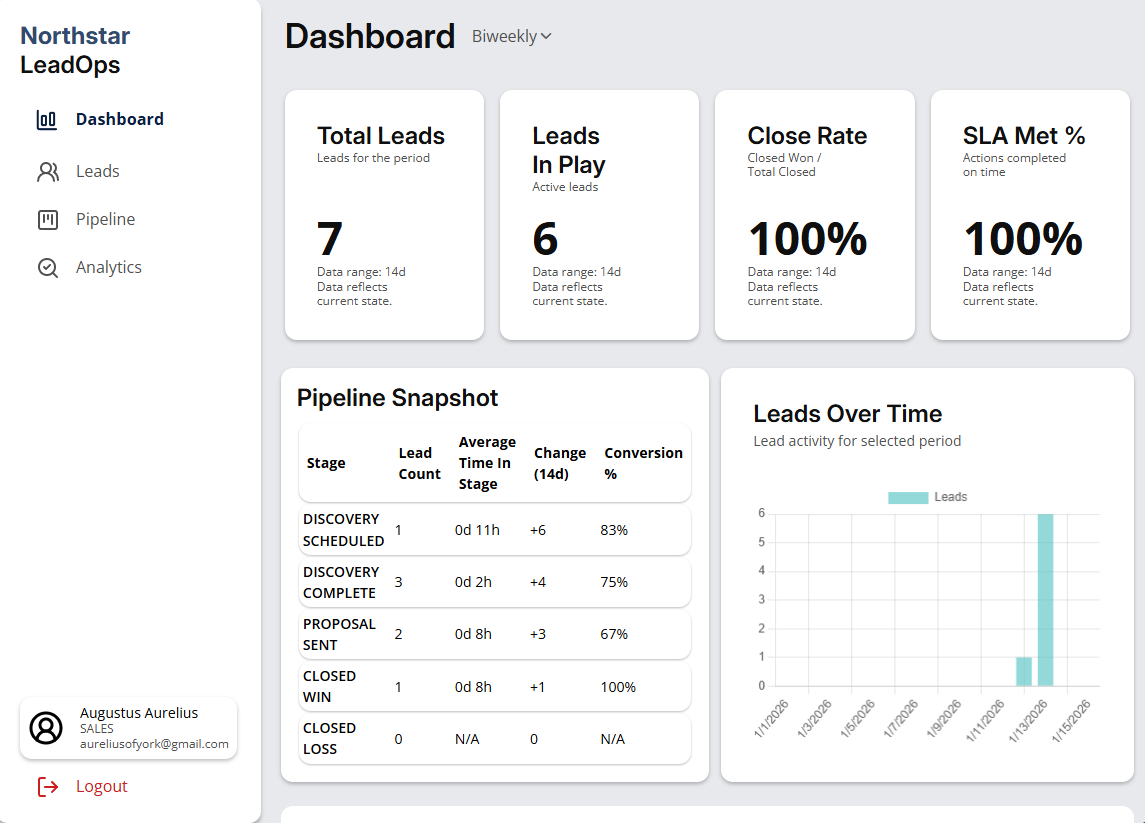
Sales Execution View
The Sales Dashboard Focuses Attention on Revenue-Critical Actions
This dashboard concentrates core sales indicators into scannable blocks aligned with daily execution. Pipeline snapshots, SLA adherence, and action queues expose urgency and risk immediately. Sales effort is directed toward deals where timing and follow-through materially affect outcomes.
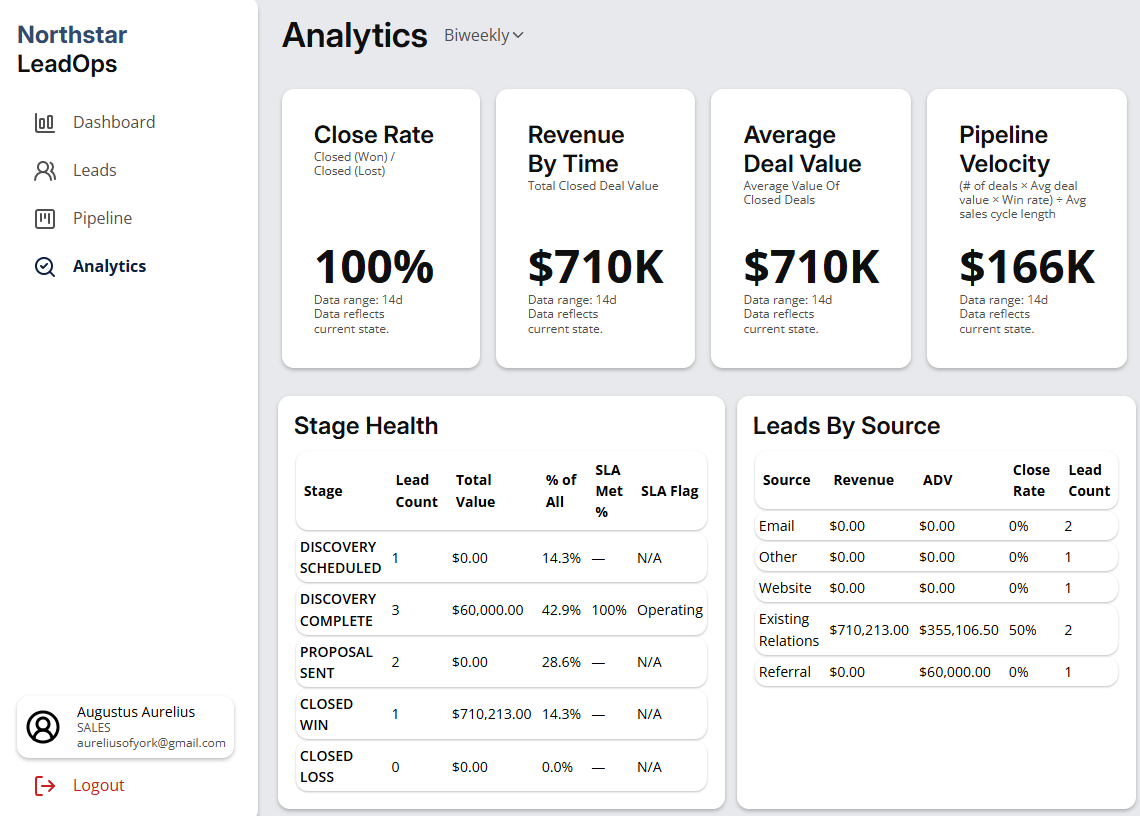
Executive Performance View
The Analytics Dashboard Enables Confident Revenue and Growth Decisions
This dashboard aggregates performance signals that reveal business health and momentum. Revenue trends, source effectiveness, stage health, and deal quality are evaluated continuously. Leadership gains the clarity needed to intervene early and reinforce high-performing strategies.
Measurable Improvements in Sales Focus, Revenue Control, and Decision Confidence
This module changes how revenue performance is understood and acted upon across the organization. Outcomes are driven by continuous visibility into pipeline behavior and execution quality. Decisions shift from reactive to deliberate as performance signals remain consistently accessible.
-
Higher Sales Efficiency Through Clear Prioritization
Sales teams focus effort on leads with the highest urgency and revenue impact. Action queues and pipeline visibility reduce wasted follow-up. Time allocation improves without increasing headcount or process complexity.
-
Improved Revenue Predictability and Deal Quality
Close rates, deal values, and stage health are tracked continuously. Weak opportunities surface earlier and strong deals receive timely support. Forecasting accuracy improves as variability becomes visible.
-
Faster, More Confident Executive Decision-Making
Executives gain real-time insight into revenue drivers and bottlenecks. Strategic interventions occur before performance degrades materially. Growth decisions rely on observed system behavior rather than delayed reports.
See How Unified Sales and Analytics Dashboards Change Revenue Outcomes
This module demonstrates how structured visibility transforms sales execution and leadership decision-making. The system is designed to scale clarity without increasing operational burden. A discovery call clarifies fit, scope, and expected impact.